Create an image map of Arcimboldo painting using mapper.js
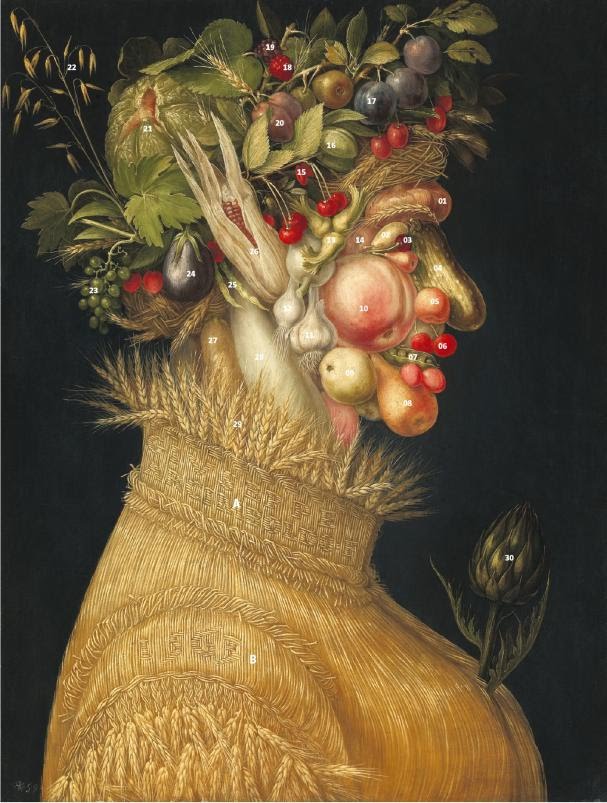
01. Onions 02. Sweet pears 03. Morello cherry 04. Cucumber 05. Apricot 06. Cherries 07. Peas 08. Pear 09. Quince 10. Peach 11. Garlic 12. Baby onion 13. Hazelnuts 14. Carrot 15. Blueberries 16. Almond 17. Plum 18. Raspberry 19. Blackberry 20. Damson plum 21. Melon 22. Ear of oats 23. Green grape 24. Eggplant 25. Broad beans 26. Corn 27. Yellow beet 28. White eggplant 29. Wheat 30. Artichoke
Explain the contents of every food according to USDA Food database including API REST JSON information with an API key freely available at https://fdc.nal.usda.gov/ and convert this info in a creative way.
In A area containing the author name explain the intention of this painting and in B area containing the year include the historical background
Example project attached with Arcimboldo summer image 1200px width in my GitHub along with mapper.js library. https://github.com/drfperez/imagemap
Code of the previous interactive image map
For example these are data from sugar content (°Brix) in strawberries coming from conventional cultivation (C) vs ecological cultivation (E) by Cayuela et al. (1997).
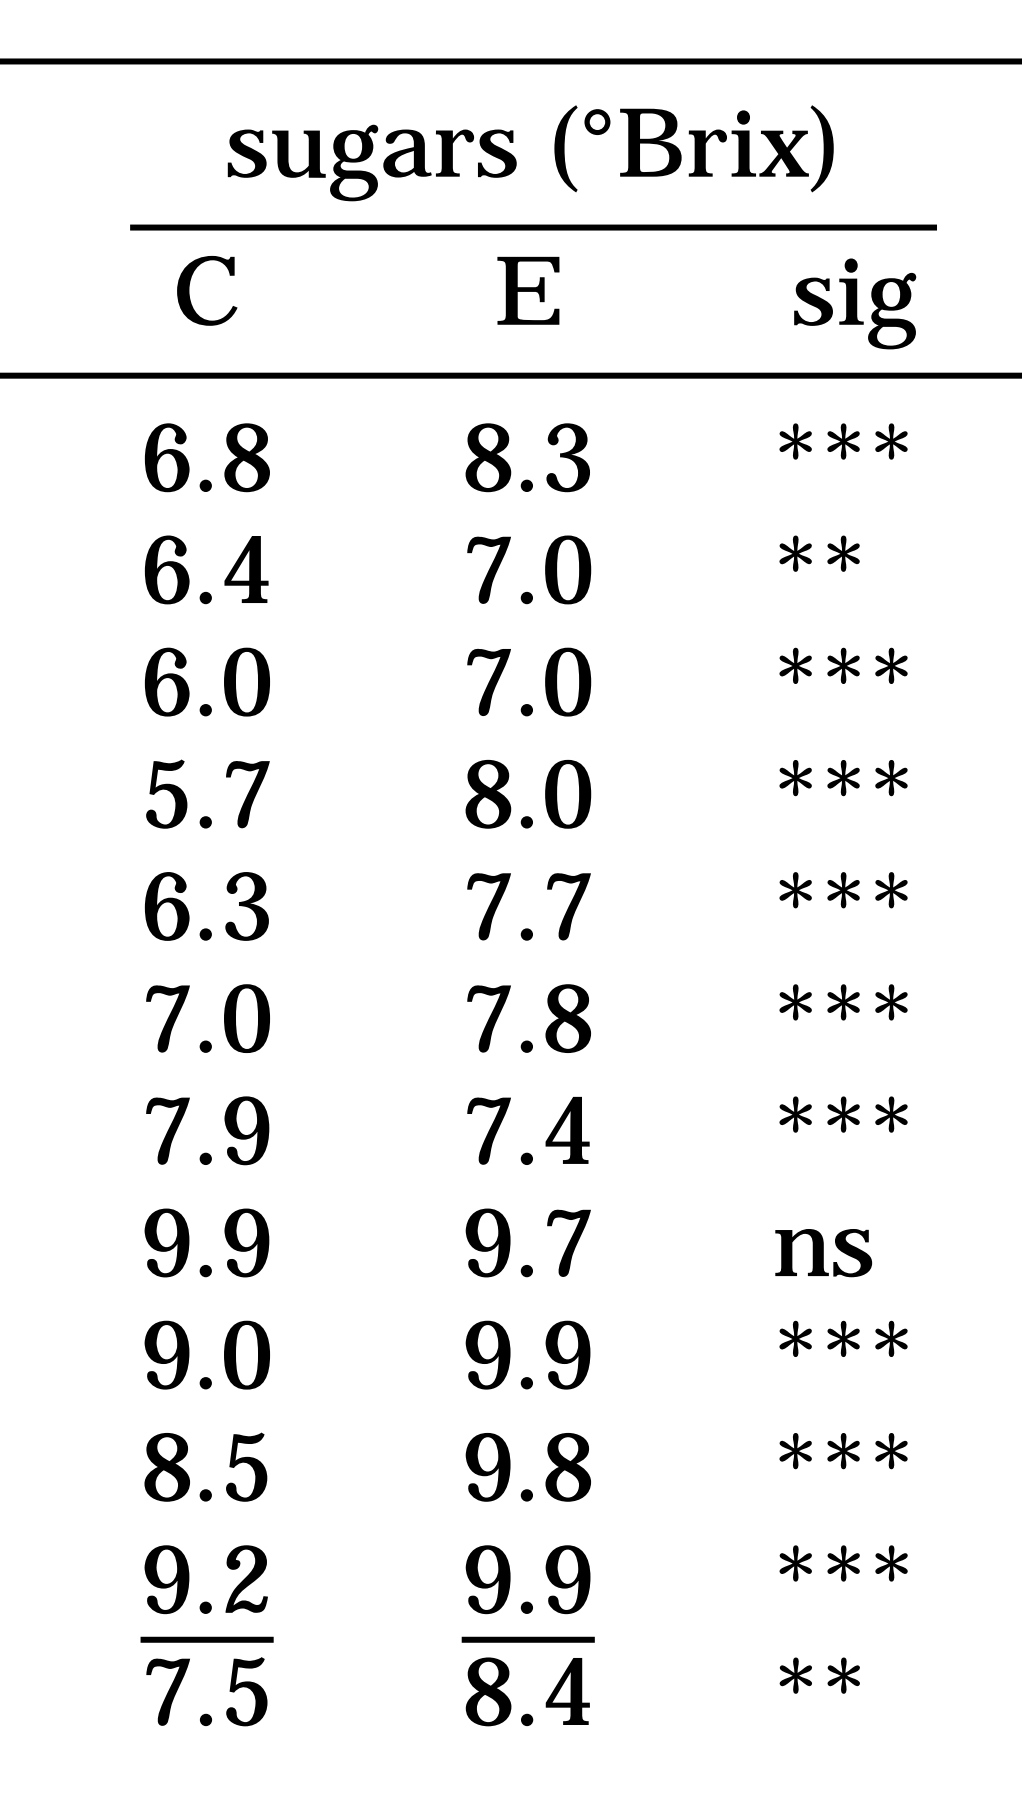
Please calculate t test from previous the data from the previous data to find out if there is statistically significant differences using t test online.
Using GraphPad Prism t test
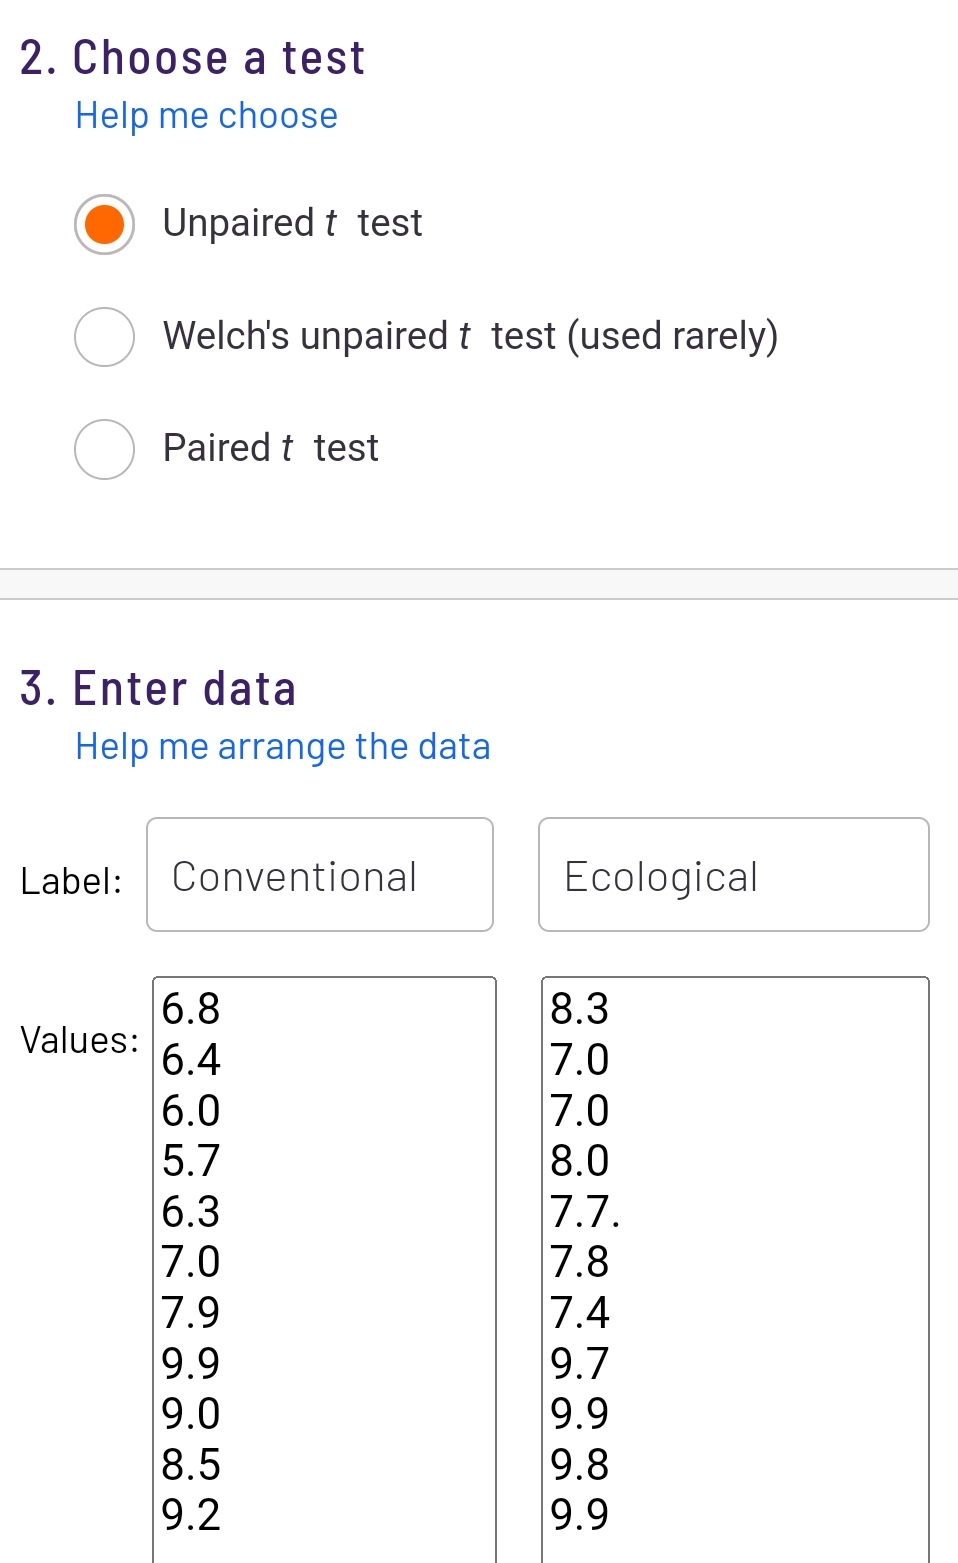
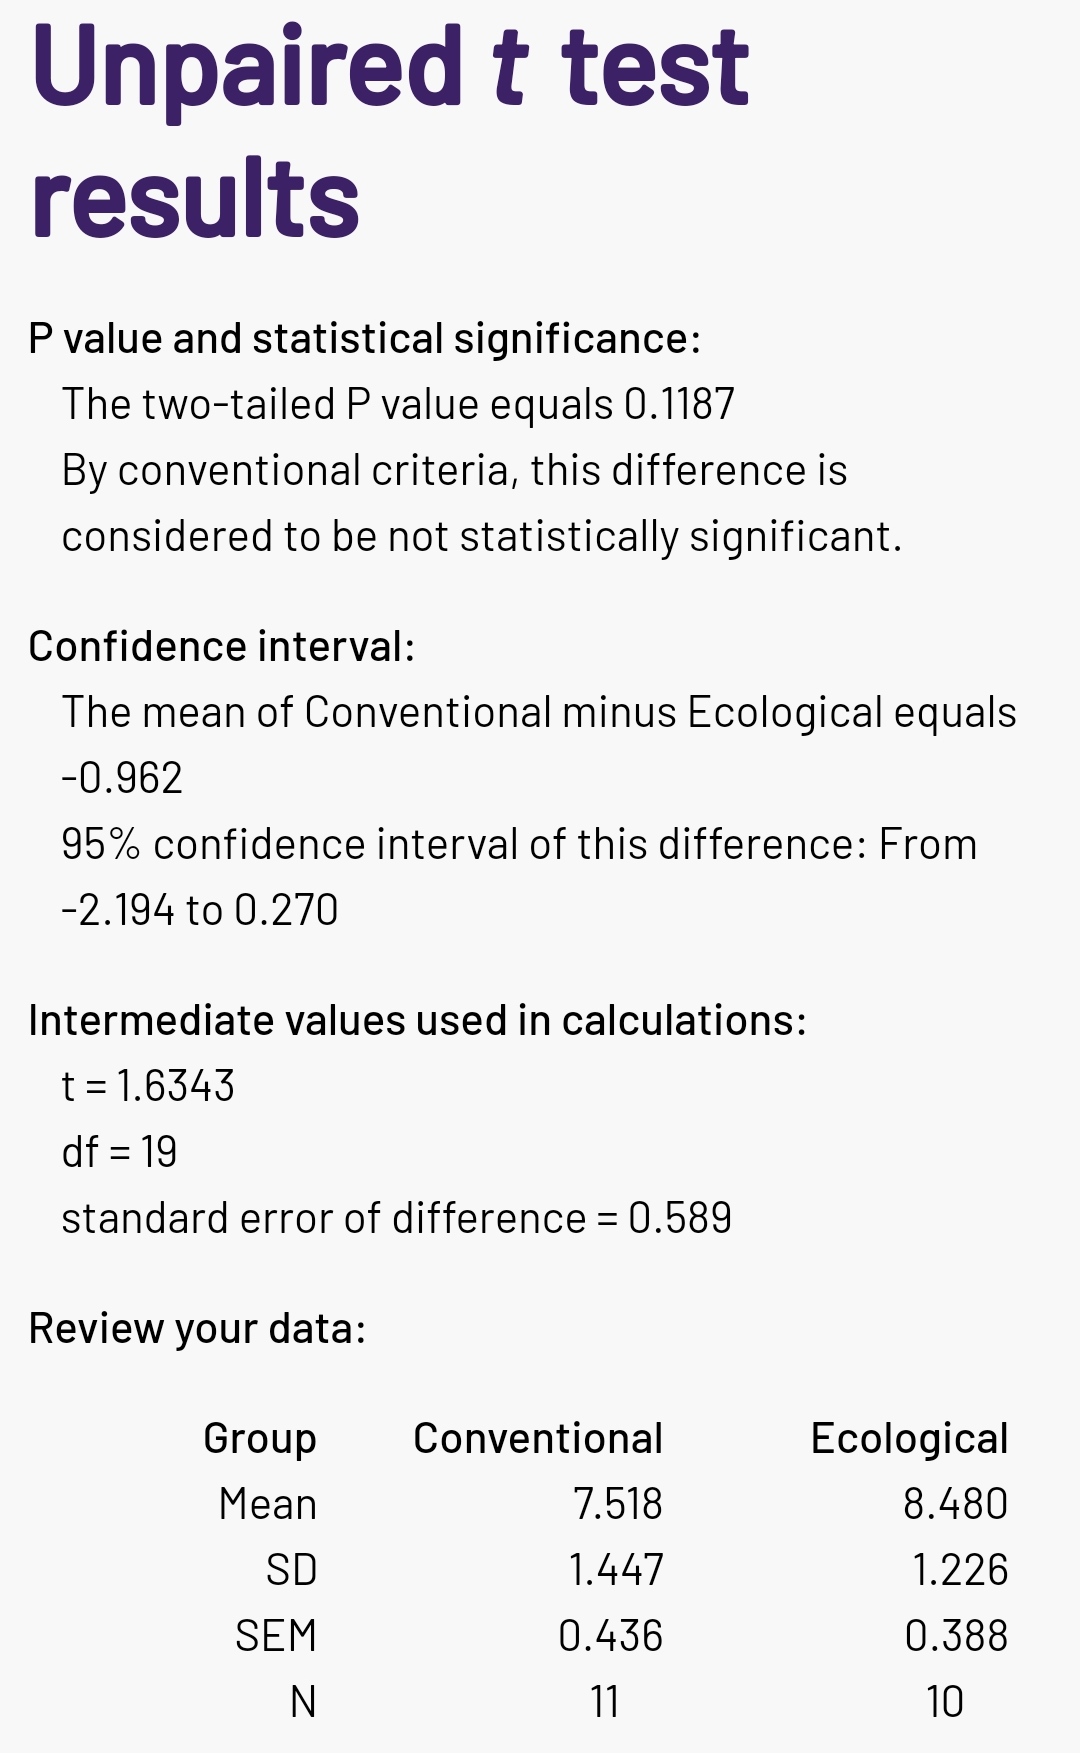
Repeat the above calculus because there is an error because the use of an extra point and check the results using GraphPad Quickcalcs website, using your calculator and formulas, using R programming language, etc.
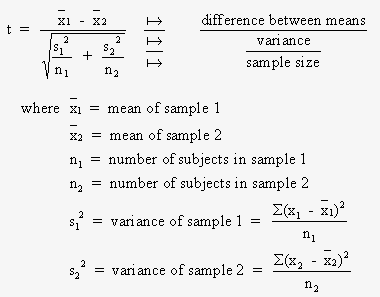
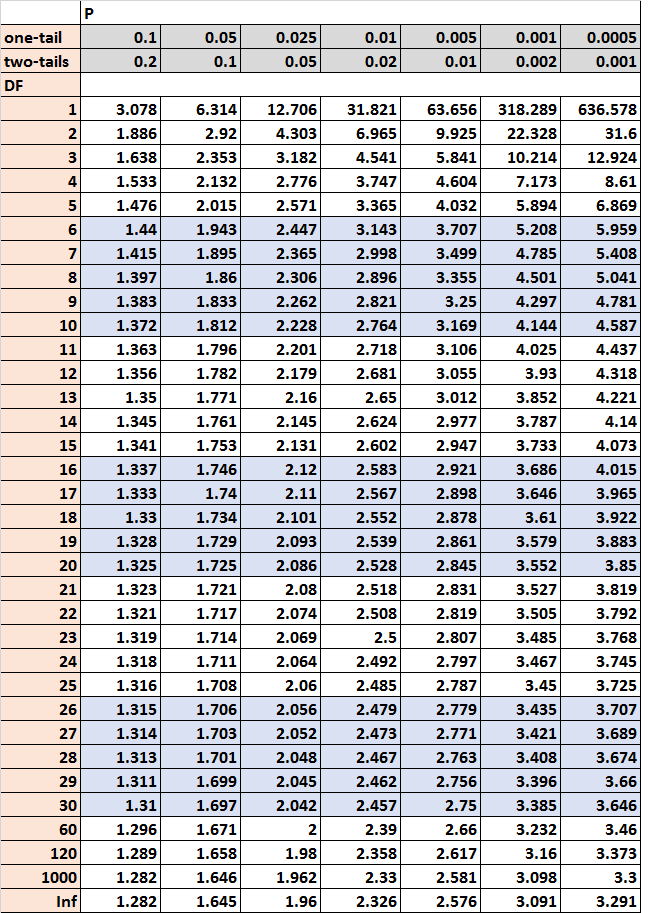
T test Formulas and t table: manual calculus
Statistical significant differences means nutritional agro-ecological relevance or anecdotic differences?